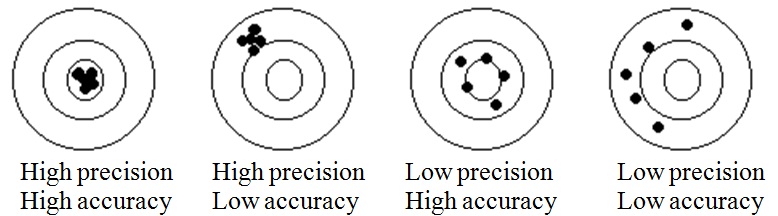
Accuracy vs. Precision
Accuracy is an indication of how close a measurement is to the true value.
Precision is an indication of the agreement among a number of measurements made in the same way.
The following examples illustrate accuracy and precision:
Systematic and Random Errors
Aside from individual mistakes, such as:
- misreading scales
- poor arithmetic
- wrongly transferred data from one place to another
- using the wrong theory or equation
errors can be divided into two main classes, systematic errors and random errors.
Systematic errors
A systematic error occurs when an instrument has high precision but low accuracy, it repeatedly gives the same reading, but the reading is not true. Systematic errors can result from:
- badly made instruments
- poorly calibrated instruments
- an instrument having a zero error (it does not read zero when measuring zero)
- poorly timed actions
- instrument parallax error (the position of the instrument may affect its readings)
Systematic uncertainty is difficult to estimate and eliminate, but there are some simple procedures which can reveal it. Two ammeters placed in series must have the same current flowing through them. If their readings are not the same then there must be a systematic error in one of them. Use a third meter if you are not sure which one is in error. Two thermometers must read the same value in the same environment. Reducing systematic error can be done by using good experimental technique and by varying the instrumentation being used. Systematic uncertainty can never be eliminated by taking repeated readings with the same built-in faults.
Random errors
A random error is caused by variation is performance of an instrument or operator. A precise experiment has a low random error, or in other words, random errors cause poor precision. Random errors are frequently caused by:
- vibrations or air currents when taking a reading
- misreadings
- variations in the thickness of a surface being measured
- not collecting enough data
- human parallax error (reading the instrument at an angle, for example)
Random uncertainties, as their name implies, result in a scatter of readings about a mean value. They have an equal chance of being positive or negative. Random uncertainty results from the inability of the observer to repeat his actions precisely. If the period of oscillation of a pendulum is being measured, an experimenter might be timing 50 swings. There are several things which cannot be reproduced exactly each time:
- the reaction time on the stopclock might vary a little;
- the start of the first swing and the end of the 50th swing may not be noted exactly;
- the same starting amplitude may not be used each time so that although the period of amplitude is nearly independent of the amplitude there is a small influence of amplitude on period;
- the hand of the stopclock may not be viewed from quite the same angle, so introducing random parallax uncertainty.
Minimizing Uncertainty
There are standard statistical methods for handling random uncertainties. These can give standard deviations for a series of readings, but when the number of readings is not large it is useful to have a method to obtain the approximate value of the uncertainty without doing a formal statistical analysis. Work through the following example to see one method of doing this.
Example - Diamter of a wire
From the set of data given in Table 1, obtain values for d, the diameter of a wire.
Table 1
Diameter of wire / mm |
0.83 |
0.83 |
0.85 |
0.83 |
0.85 |
0.86 |
0.85 |
Average 0.843 |
First obtain the differences between the average value and the individual values. Ignore positive and negative signs. This gives the results of Table 2 which is normally the only table drawn up.
Table 2
| Diameter of wire / mm |
Difference / mm |
| 0.83 | 0.013 |
| 0.83 | 0.013 |
| 0.85 | 0.007 |
| 0.83 | 0.013 |
| 0.85 | 0.007 |
| 0.86 | 0.017 |
| 0.85 | 0.007 |
| Average 0.843 | 0.011 |
The average difference is a measure of the uncertainty of the reading, so given these values: diameter = (0.84±0.01) mm.
Limit of Reading and Absolute Error
The limit of reading of an instrument is equal to the smallest graduation of the scale of an instrument. The degree of uncertainty of a measurement, also called the absolute error is equal to half this limit of reading. For digital instruments, the absolute error will be taken as the limit of reading.
When taking a measurement just once (unlike in the examples above where many trials were done and averaged) you can use ½ the limit of reading of the instrument as the uncertainty in your measurement, but only if you use the instrument perfectly and no other uncertainty needs to be accounted for.
The limit of reading of some common lab instruments are given in the table below.
| Instrument | Limit of Reading | Absolute Error |
| Ruler or meter-stick | 1mm | ±0.5mm or ±5×10⁻⁴m |
| Triple beam balance | 0.1g | ±0.05g or ±5×10⁻⁵kg |
| Digital balance 0.01g | 0.01g | ±0.01g |
Should I always use ½ the Limit of Reading as the uncertainty in a measurement? No.
Just because an instrument, if used perfectly, could give you a very precise measurement, this does not mean that you will always use the instrument to the best precision.
Consider the example of using a meter-stick with a 1 mm limit of reading to measure the length of the classroom. As you move the meter-stick end-over-end to measure the length, you are introducing human error into your measurements, and it would be silly to express your final measurement as something like 935.25cm ± 0.05cm. You have to lift the meter-stick 9 times to get a measurement, with the probably introduction of at least a 0.5cm uncertainty each time. You could therefore give the measurement as 935cm ± 5cm.
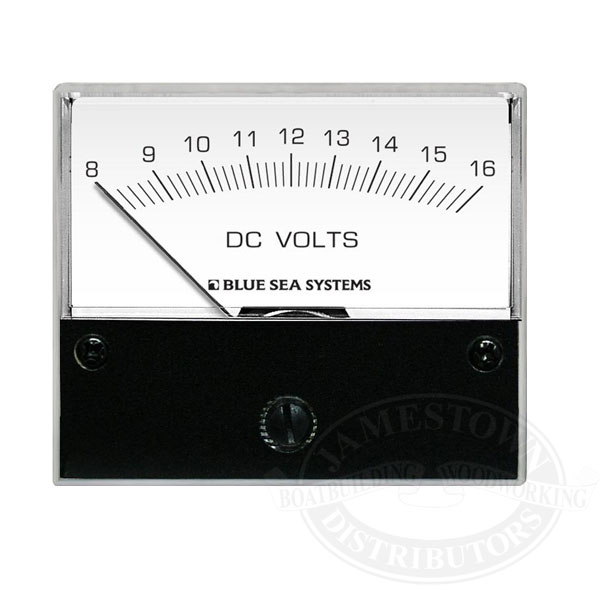 Consider the measurement of voltage using a voltmeter with a moving needle, as in the diagram. The voltmeter may be very precise, but if while taking the measurement the needle never stops moving, then you cannot use the limit of reading to define the uncertainty of your measurement. If the needle oscillates between a maximum and minimum value, then use the central value as the measurement, and the ½ the range as the uncertainty. For example, a voltmeter with a limit of reading of 0.2V oscillates between 10.2V and 13.6V. The measurement would be 12V ± 2V.